Power BI
Dashboards
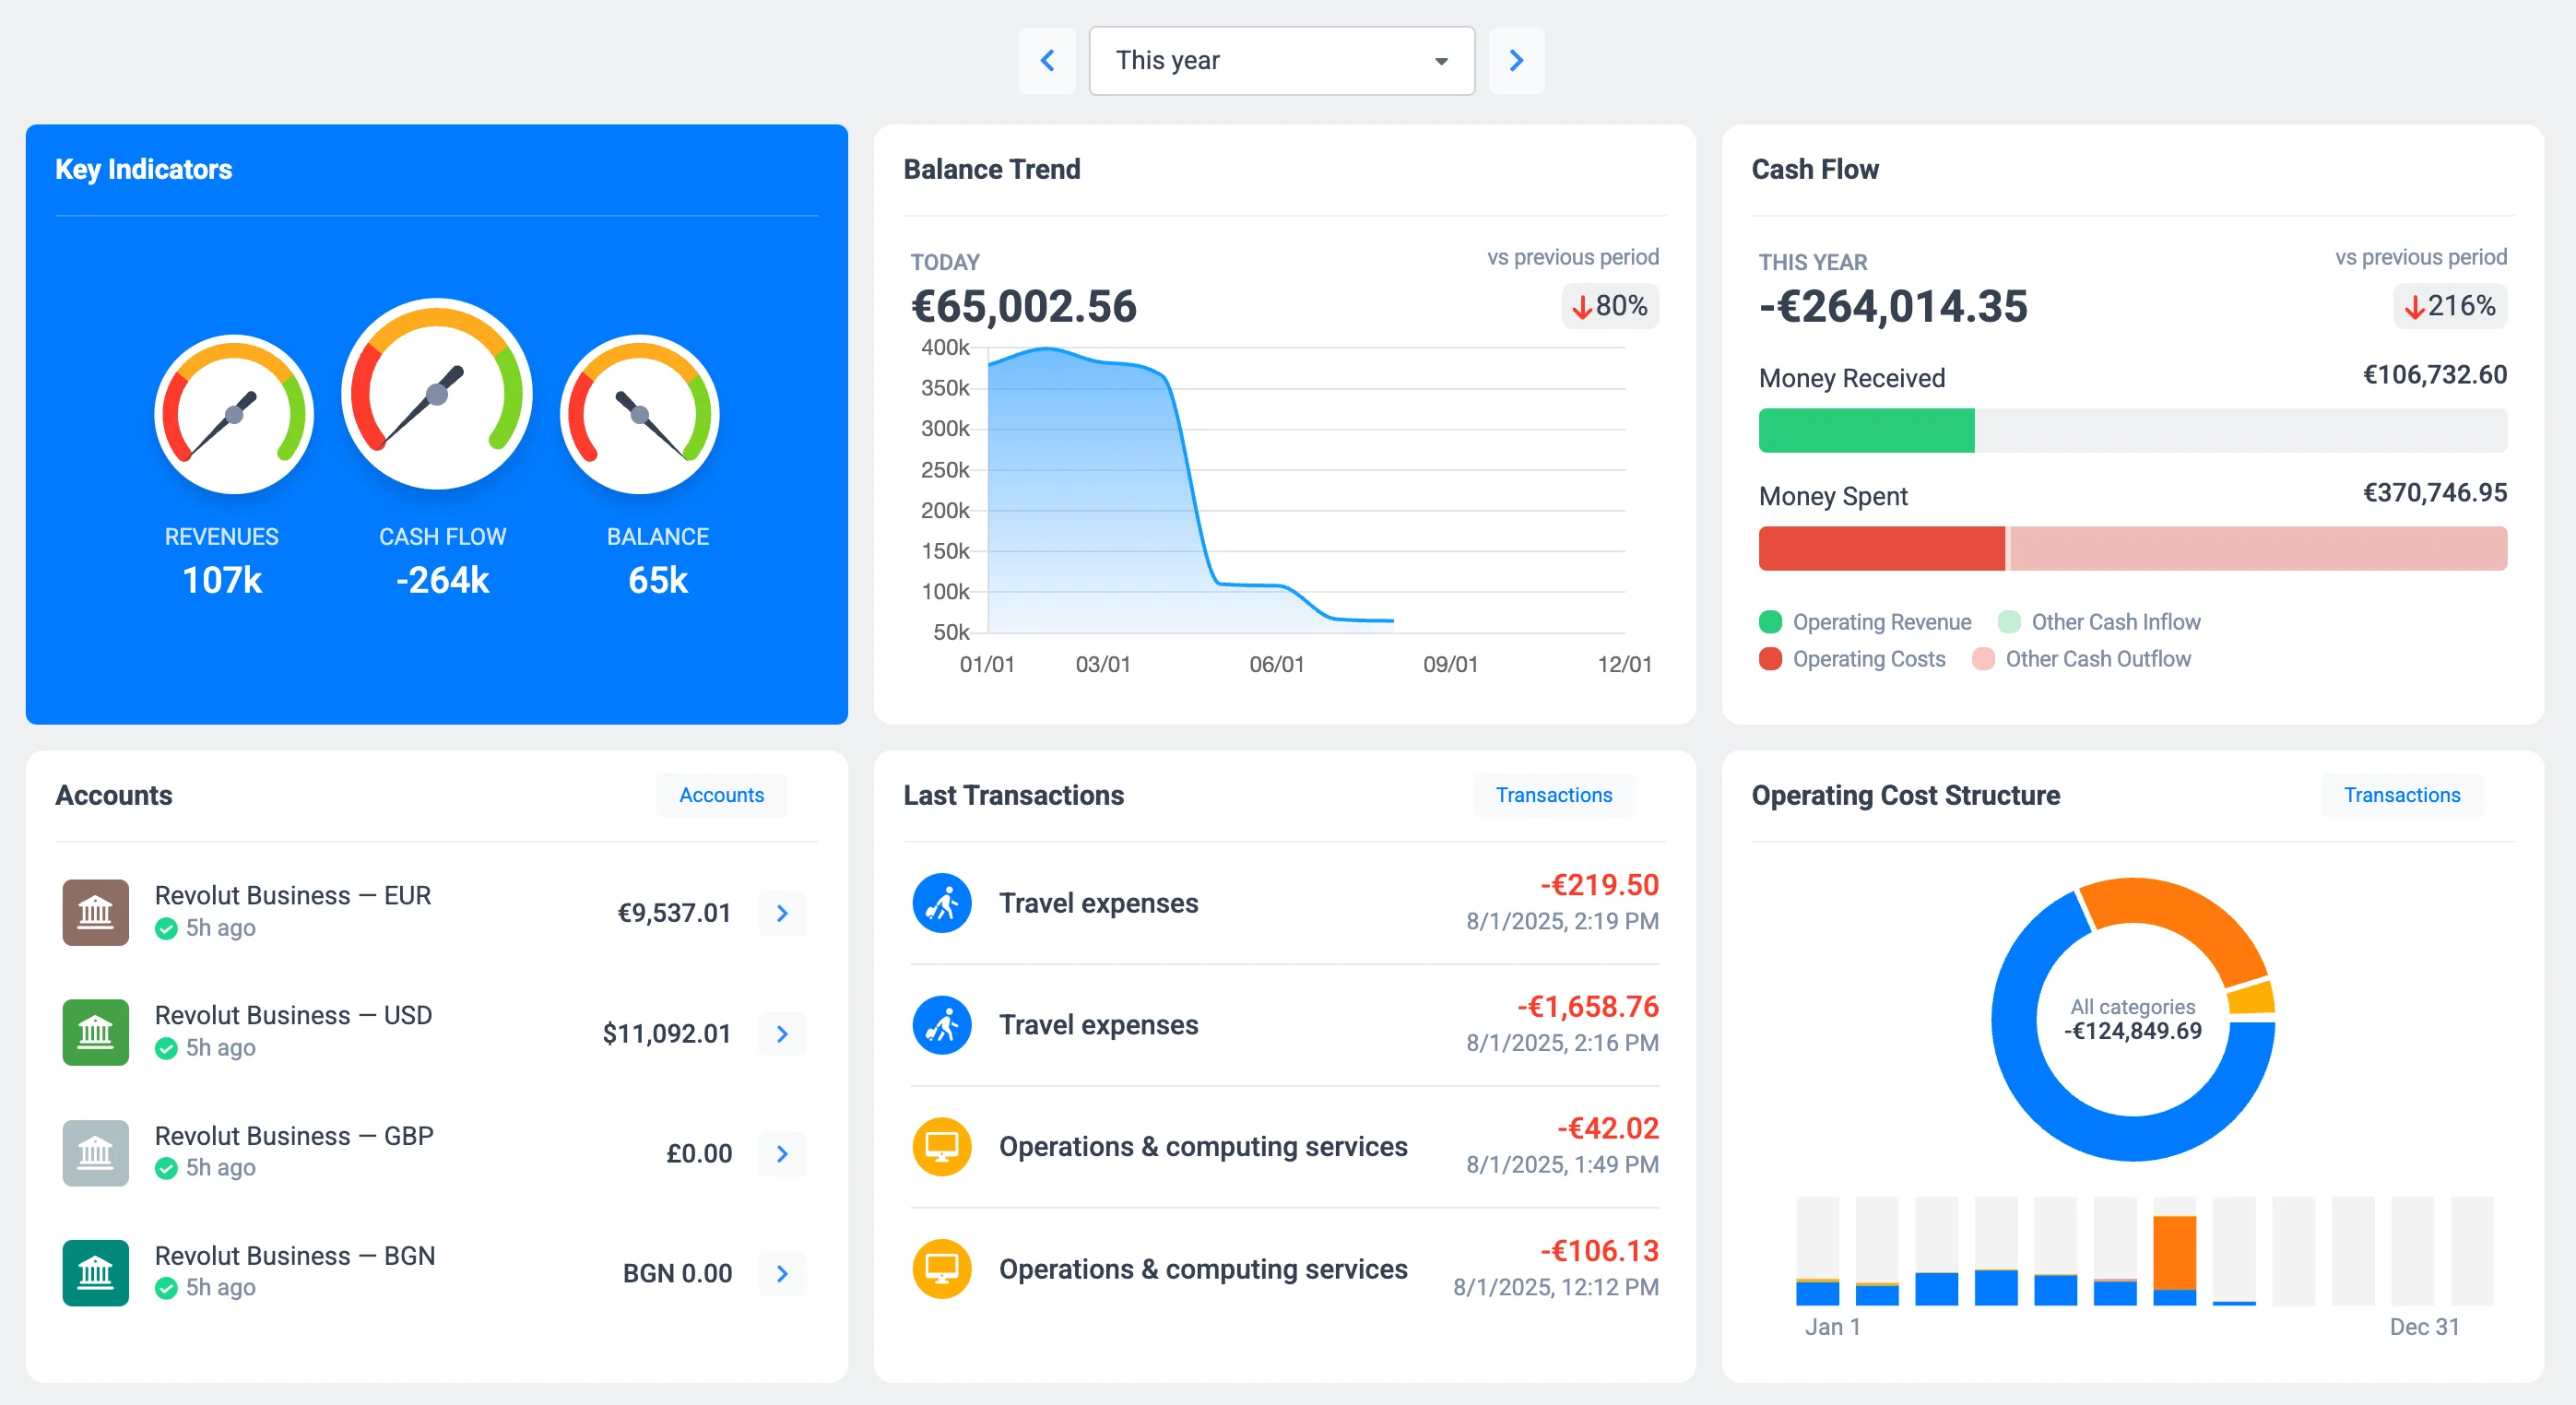
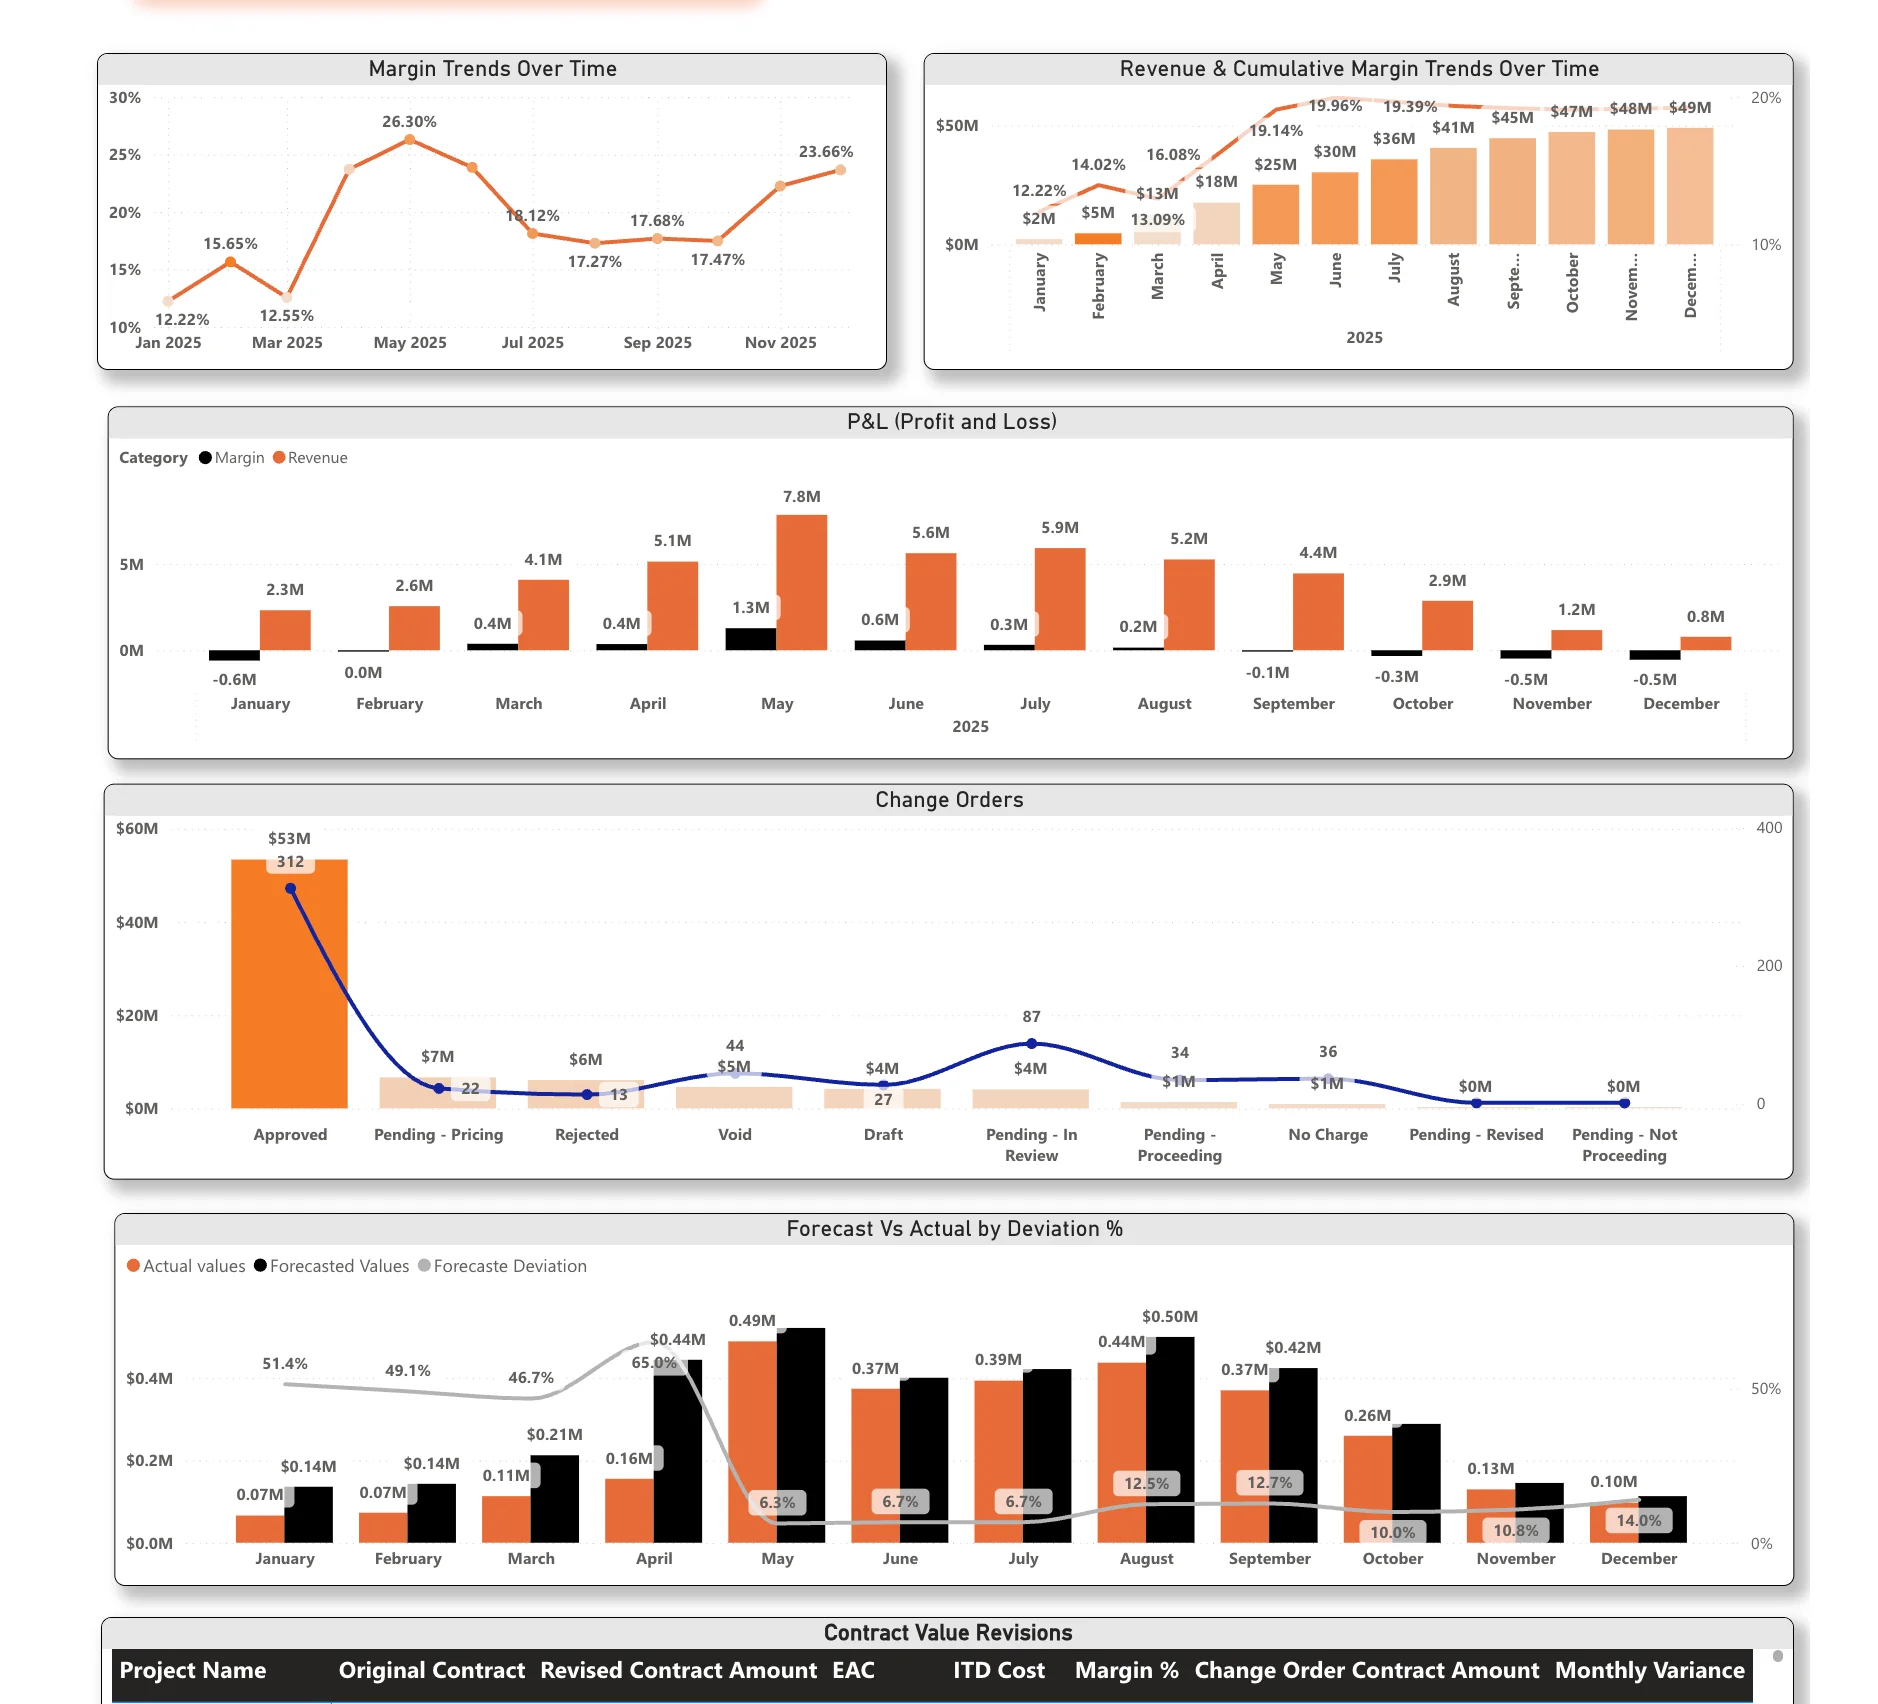
Custom Power BI dashboards with scalable models, row-level security, and mobile-ready layouts.
Clients typically save 15–20 hours of manual reporting per week.
Business Intelligence & API Automation
We build automated BI dashboards and data pipelines in Power BI, Tableau, and Looker Studio — so your team spends less time on manual reports and more time acting on insights.
What business problems do you solve? End-to-end reporting automation that converts raw API data into interactive BI dashboards.
Can you automate my data? Yes. We write custom scripts for Shopify, Google Ads, and CRM APIs. Real-time syncing, zero manual work.
Serving startups, agencies, and mid-size businesses worldwide with remote-first dashboard development.
Powered by Robust Architecture
End-to-end dashboard development and reporting solutions tailored to your data stack.
Custom Power BI dashboards with scalable models, row-level security, and mobile-ready layouts.
Clients typically save 15–20 hours of manual reporting per week.
Interactive Tableau dashboards with pixel-perfect visuals, live or extract connections, and embedded analytics.
Delivered within 7–14 days, fully connected to your live data.
Fast, shareable Looker Studio reports with blended data sources, automated refreshes, and stakeholder-friendly views.
Free tool, professional setup — shareable with your entire team instantly.
Reliable API integrations that unify ads, CRM, finance, and operational data into a clean reporting model.
Shopify, Google Ads, HubSpot, and more — automated and always up to date.
Real outcomes from real projects.
Years of Analytics Experience
Clients Across Industries
Projects Delivered
Customer Satisfaction
Manual Reporting Hours Eliminated
From raw data to decision-ready dashboards — delivered by a specialized analytics consultancy.
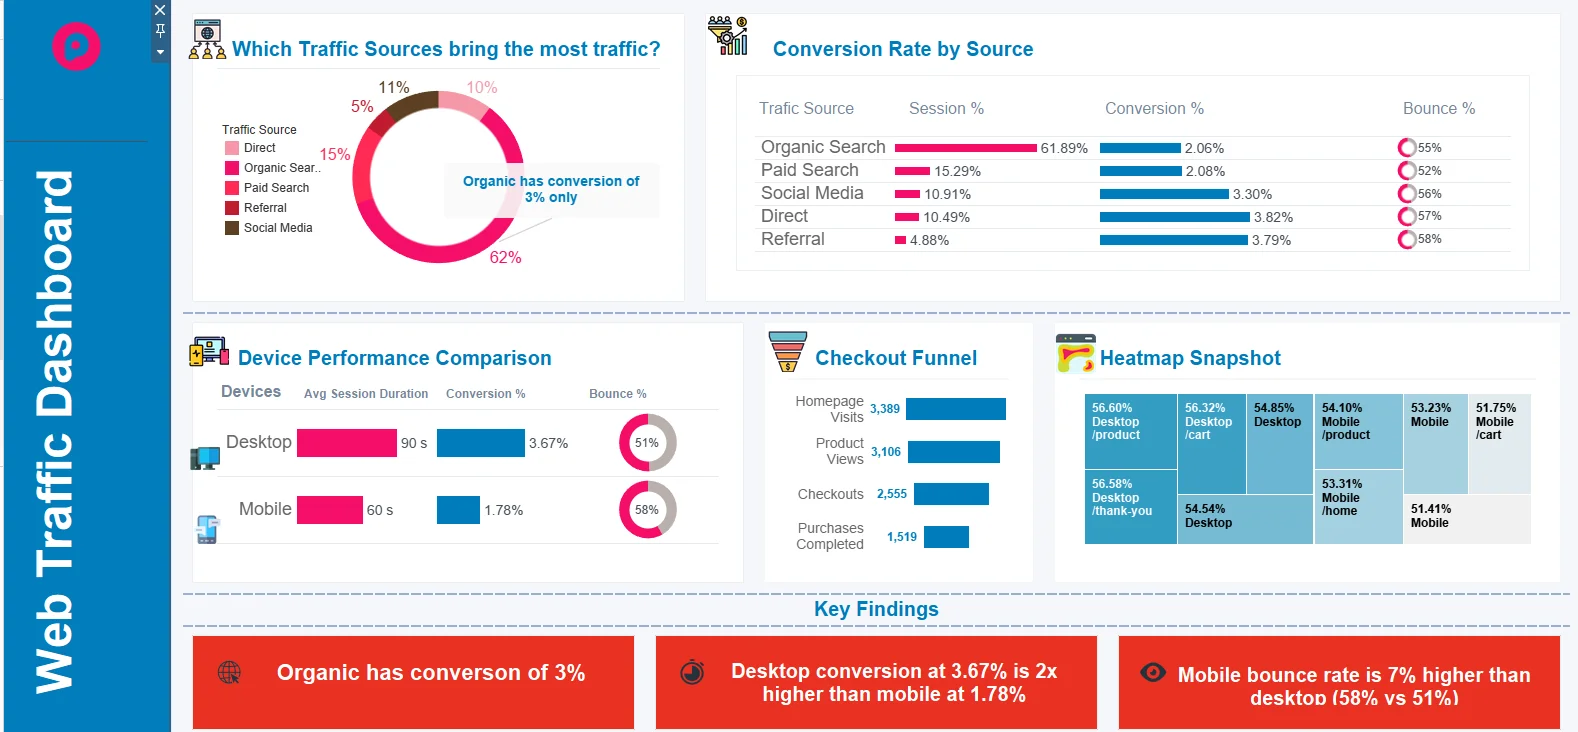
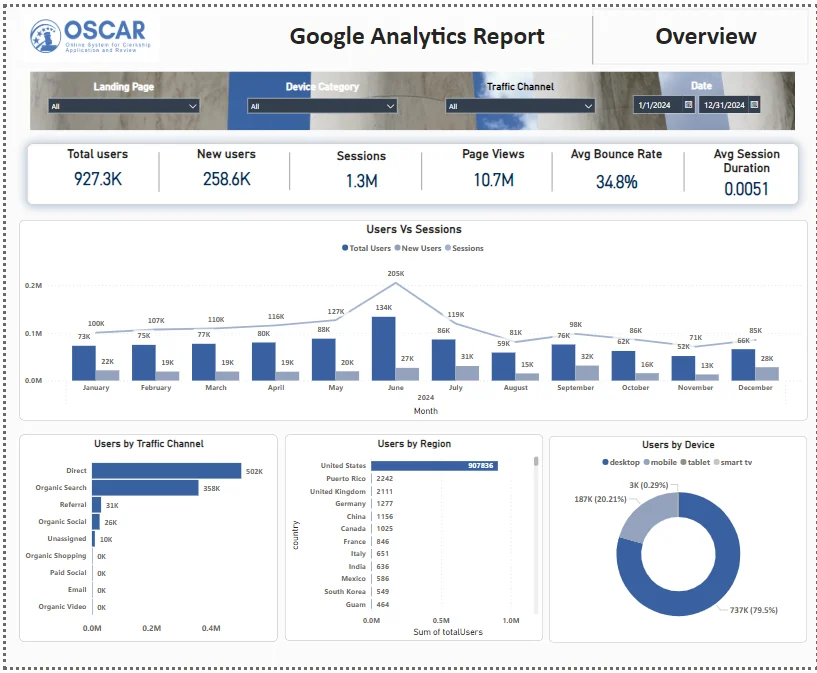
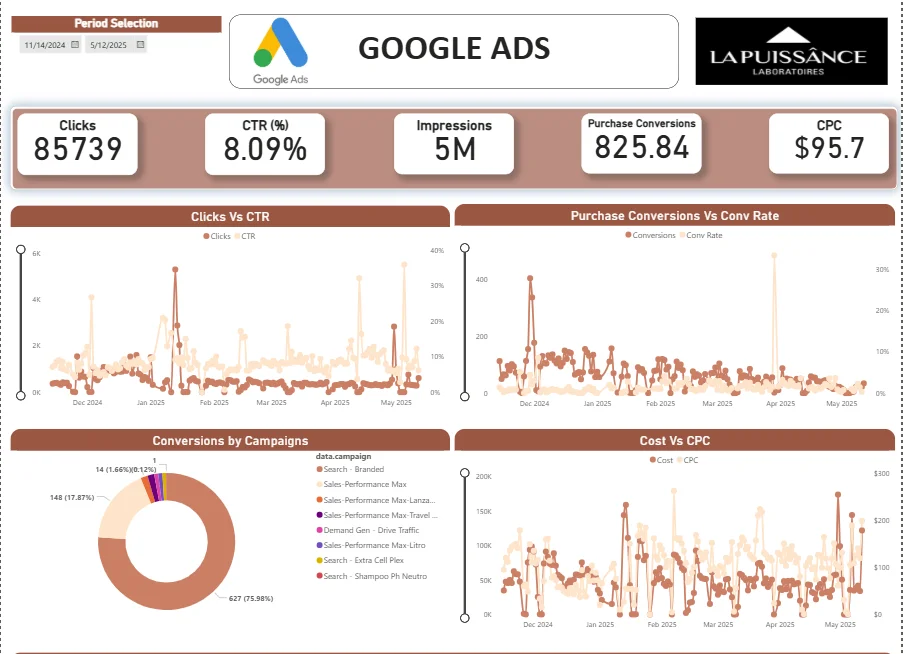
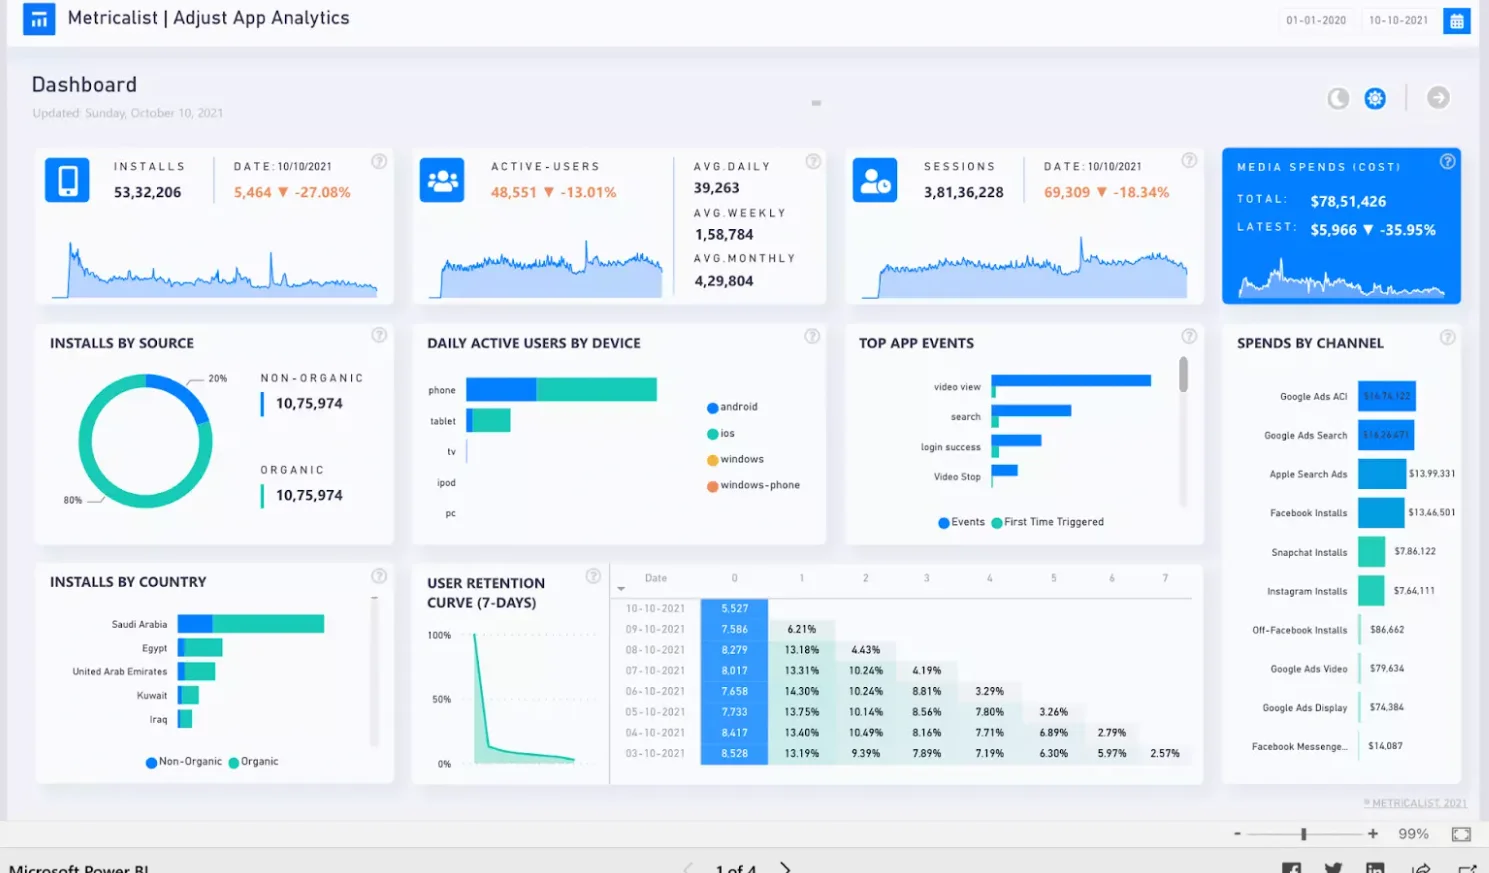
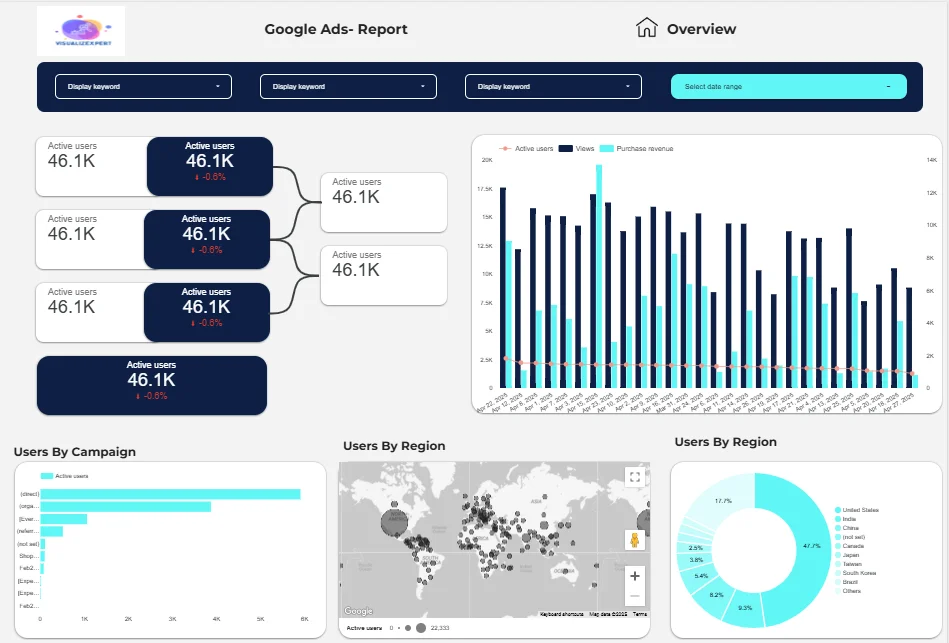
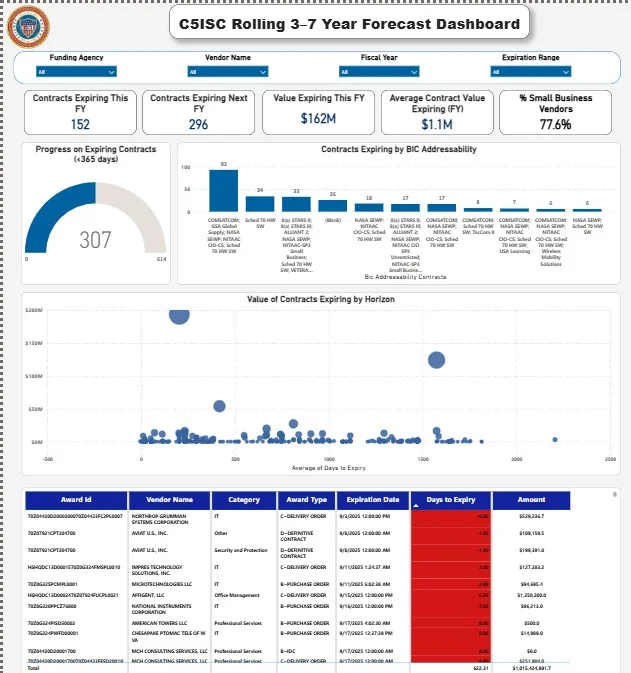
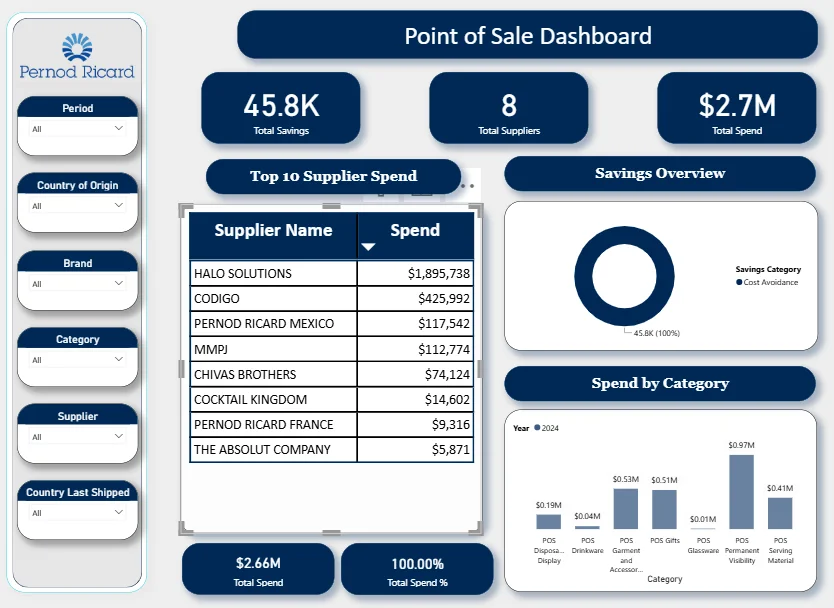
Real dashboard examples built for marketing, finance, operations, and leadership teams.
Clear, honest answers to help you understand our dashboard and analytics delivery process.
Most dashboards are delivered within 7–14 days depending on data complexity, number of sources, and feedback cycles. Initial drafts are usually shared within a few days once data access is confirmed.
We build dashboards in Power BI, Tableau, and Google Looker Studio. The right tool depends on your data stack, refresh requirements, and how stakeholders consume reports.
Yes. We integrate APIs, databases, spreadsheets, CRMs, ad platforms, and e-commerce tools into a unified reporting model, eliminating manual reporting and inconsistent KPIs.
Yes. We work across marketing, finance, operations, and leadership teams, building role-specific dashboards while maintaining a single source of truth.
Yes. Dashboards can be configured with role-based access so executives, managers, and analysts only see the data relevant to their role.
Yes. We offer ongoing support, enhancements, and automation improvements as your data, tools, or business needs evolve.
Tell us about your data and reporting setup. We'll review it and reply within one business day with clear next steps — no commitment required.