The Business Challenge
Our client, a mid-sized Fintech firm operating across Europe and North America, was struggling with data fragmentation. They had 12 distinct regional entities, each using a different version of QuickBooks and Xero.
The CFO's team spent the first 10 days of every month manually exporting CSVs, cleaning exchange rates in Excel, and attempting to merge them into a consolidated P&L. This manual process was prone to human error and meant that executives were always looking at data that was two weeks old.
They needed a solution that would provide real-time visibility into Global Net Margins, Operating Expenses (OpEx), and EBITDA without the manual heavy lifting.
Key Pain Points Identified
- Data Silos: Financial data lived in 12 different disconnected ERP instances.
- Currency Complexity: No automated way to handle multi-currency conversion (USD, EUR, GBP) for consolidated reporting.
- Slow Reporting: The "Month-End Close" process took 10 days, delaying strategic decisions.
- Security Risks: Sensitive financial spreadsheets were being emailed between departments.
The VisualizExpert Solution
We architected a "Hub-and-Spoke" data model using Power BI and Azure SQL to centralize all 12 entities into one source of truth.
Our Technical Approach & Architecture
At VisualizExpert, we don't just drag-and-drop charts. We engineer data systems. For this financial transformation, we implemented a robust ETL (Extract, Transform, Load) pipeline.
1. Data Ingestion & Warehousing
We utilized Python scripts to hit the APIs of both Xero and QuickBooks nightly. This raw data was extracted and loaded into an Azure SQL Database. By staging the data here first, we created a historical archive that Power BI could query efficiently, ensuring the reports load in under 3 seconds.
2. Advanced Data Modeling (The Star Schema)
Inside Power BI, we built a classic Star Schema. We created a central Fact_GeneralLedger table surrounded by dimension tables for Date, Cost Center, Entity, and Chart of Accounts.
This clean modeling allowed us to write simpler, faster DAX measures. Instead of writing complex logic for every visual, the model did the heavy lifting.
3. Currency Conversion with DAX
Handling multi-currency is tricky. We connected to a live Exchange Rate API. We then wrote a dynamic DAX measure called [Total Revenue (USD)] which looks up the exchange rate for the specific transaction date and converts the local currency to the reporting currency instantly.
Total Revenue USD =
SUMX( 'General Ledger',
'General Ledger'[Amount] * RELATED('Exchange Rates'[Rate])
)
The Dashboard Features
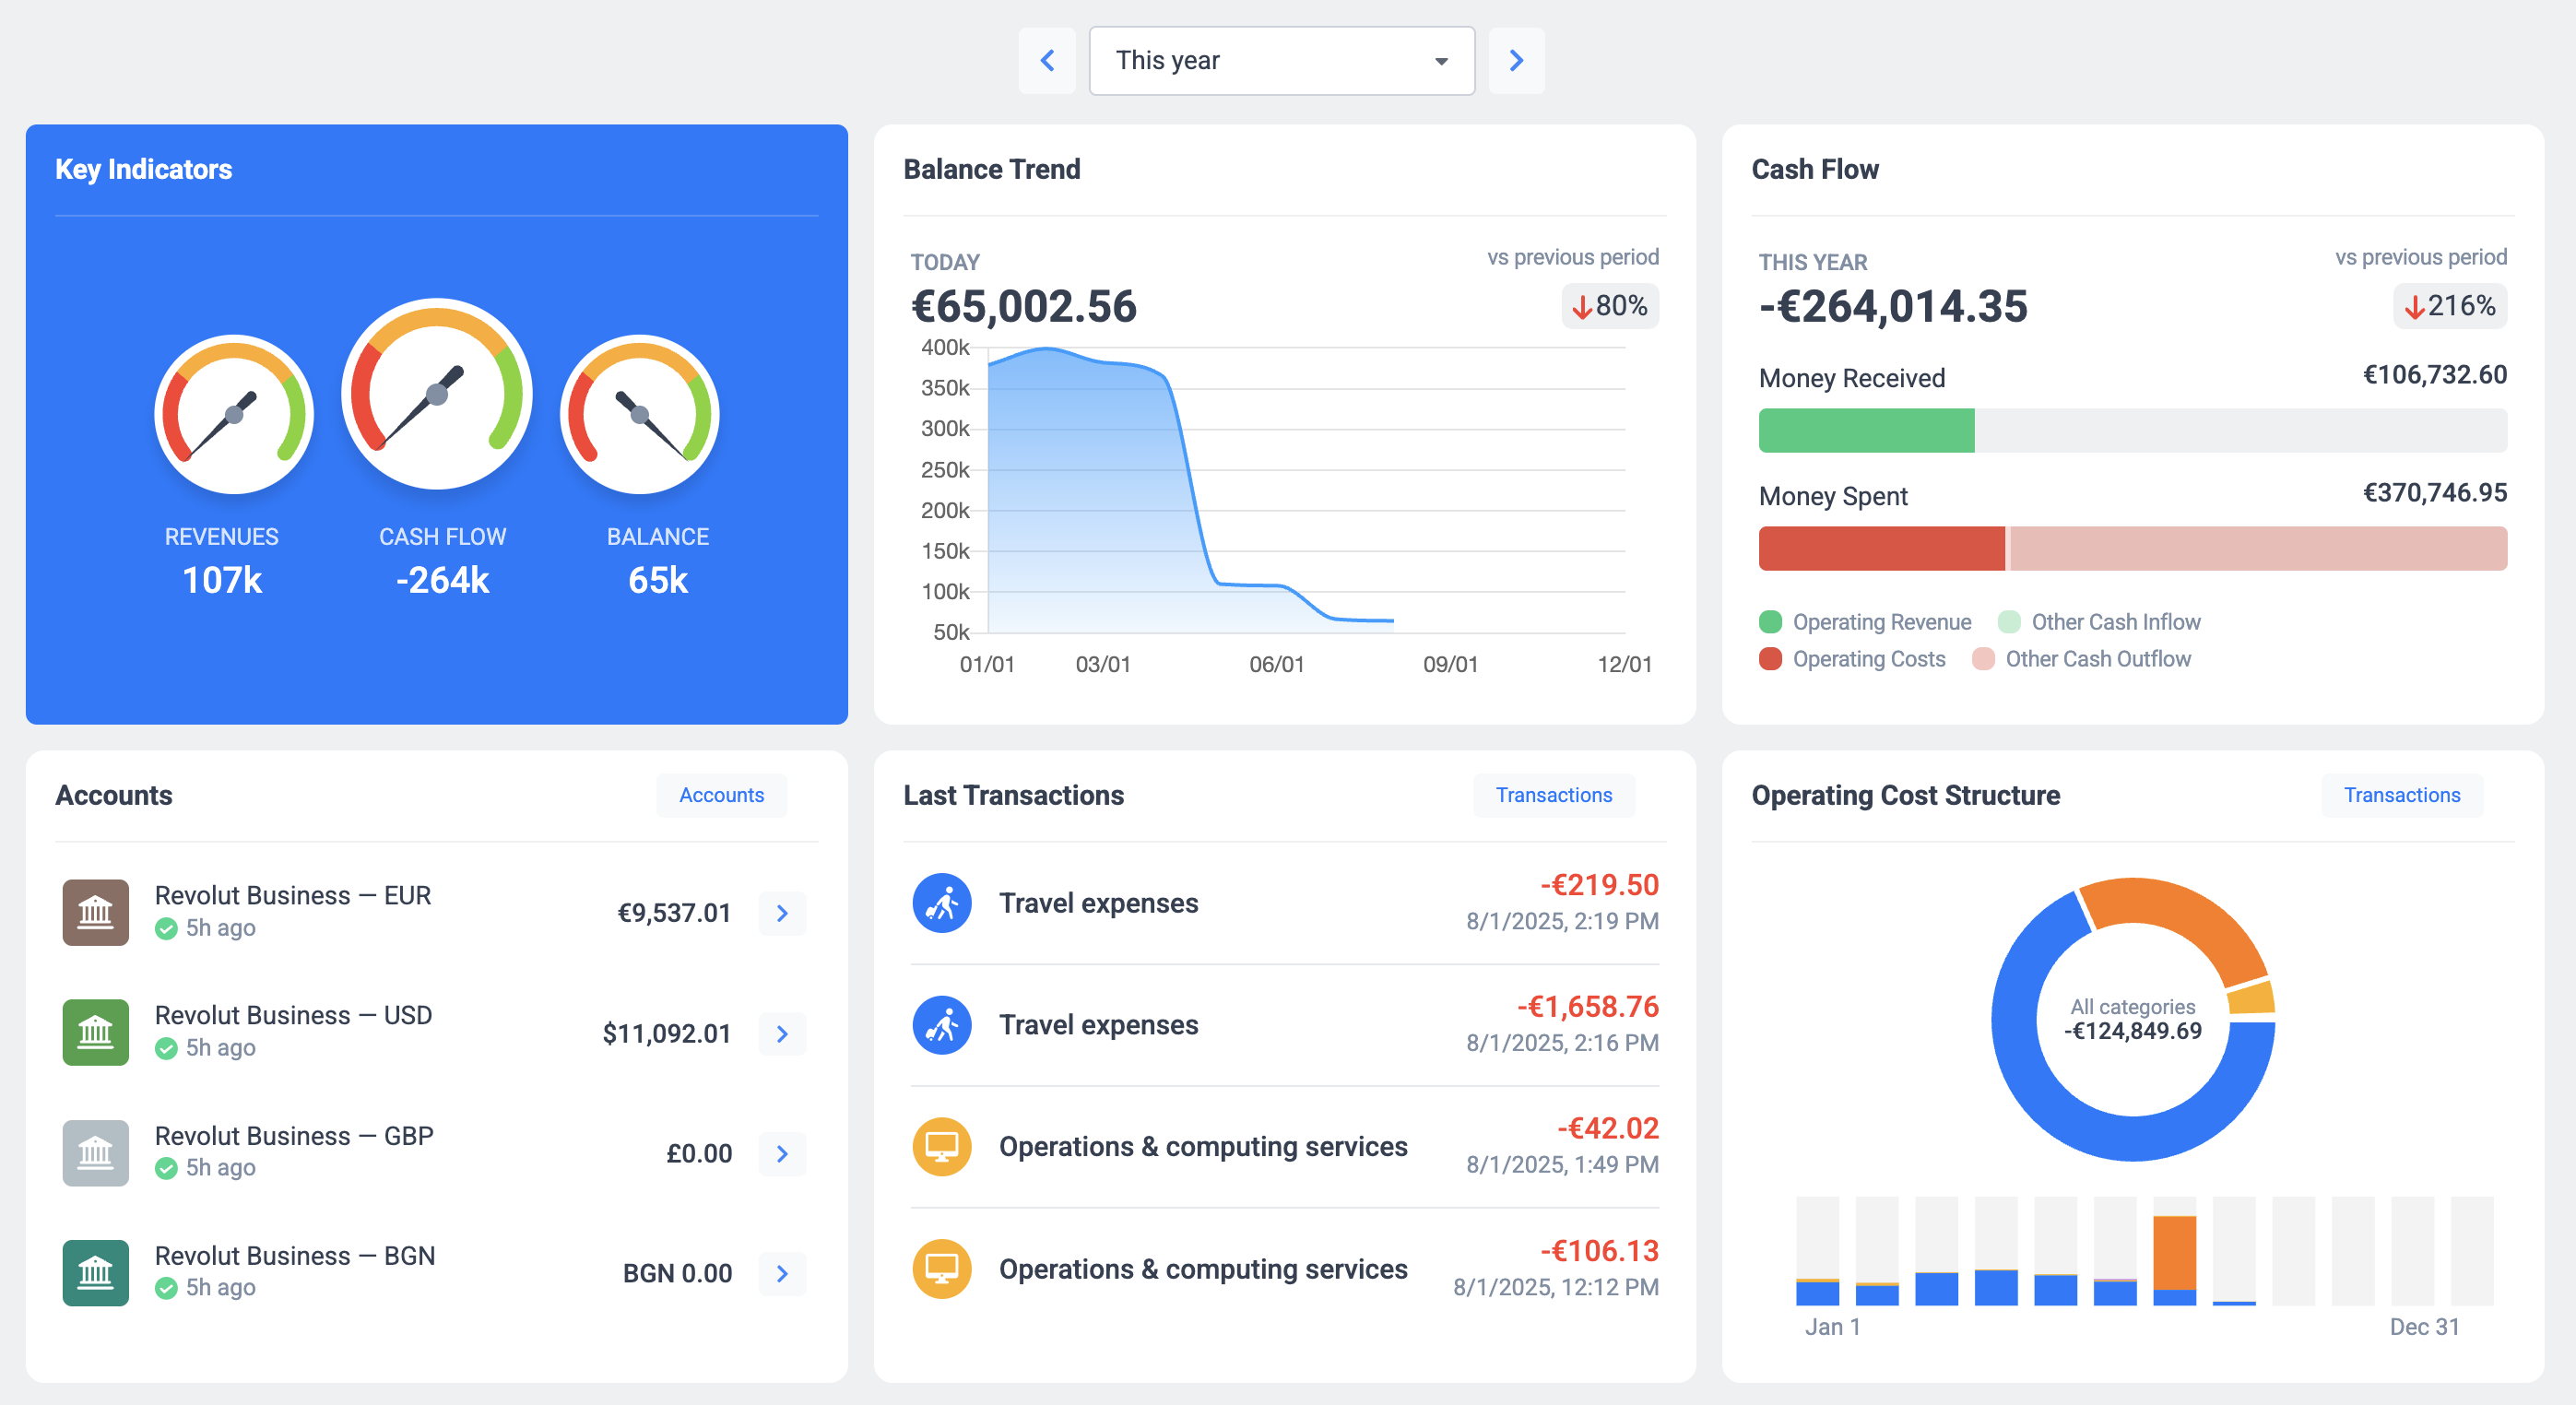
The final deliverable was a suite of three interactive Power BI reports tailored for the C-Suite.
- The CFO Overview: A high-level view of EBITDA, Net Profit Margin, and Cash Flow trends. Includes a "What-If" parameter to simulate how hiring 10 new staff would impact the bottom line.
- The Regional Breakdown: A map-based view allowing Regional Directors to filter specifically for their territory (e.g., "Show me UK & Germany only").
- Expense Drill-Down: A detailed matrix allowing the finance team to click on "Marketing Expenses" and see the individual invoice-level details without leaving the dashboard.
Results & Business Impact
Post-deployment, the results were immediate and measurable. The automation of data collection saved the finance team approximately 45 hours per month.
More importantly, the "Month-End Close" window shrank from 10 days to just 48 hours. Executives now have daily pulse-checks on company health, allowing them to pivot strategies mid-quarter rather than post-quarter.
Summary of Wins
Ready to Automate Your Financial Reporting?
If your finance team is drowning in spreadsheets and manual currency conversions, it’s time to modernize. At VisualizExpert, we specialize in turning complex financial data into clear, actionable Power BI dashboards.